
10 Cool Infographics That Explain a Process
August 9, 2018
Think about the last time you were in a bookstore. Did you grab a book off the shelf? If you did, it was probably because of the flashy, graphically-designed book cover that caught your attention. A book cover’s job is to take all of those lengthy chapters and sum them up in the simplest, most appealing way possible.
Infographics serve a similar purpose. They’re the perfect visual way to take a drawn-out process and turn it into something that’s easily digestible. That means, in the world of content marketing, infographics are as good as gold.
Check out these stats, according to HubSpot:
- Infographics are liked and shared on social media three times more than any other type of content.
- People following directions with text and illustrations do 323 percent better than people following directions without illustrations.
- Readers spend more time looking at relevant images than they do reading text on the page.
Infographics are a tactical piece of content that should absolutely be a part of your digital marketing strategy. Of all the infographics we’ve come across, here are 10 of our favorites that explain a process. Use these techniques to catch the attention of your website visitors, and soon they’ll be turning into customers.
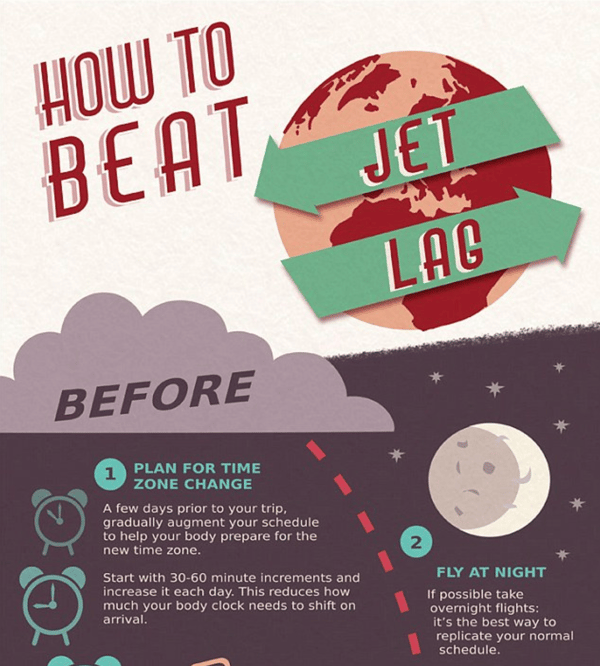
1. How to Beat Jet Lag
You’ve just landed in Europe, and you’re ready for the trip of a lifetime. There’s just one problem ... you’re jet-lagged. This infographic does an awesome job of explaining how to beat the process of changing time zones. Most noteworthy, look at the way the color tones gradually become more positive from the top to the bottom. It’s a subtle shift but a great way to keep someone scrolling. Brilliant.
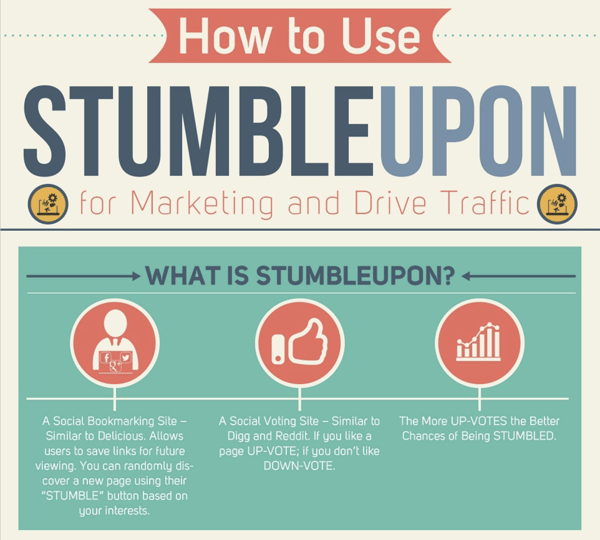
2. How to Use StumbleUpon
You’re probably familiar with social sites such as Facebook, Instagram, and LinkedIn. But have you ever heard of StumbleUpon? This infographic explains everything—what the platform is, why you should use it, and how to use it. That’s a dynamic resource that could easily be repurposed across its website (or even turned into a three-panel brochure). Keep ideas like this in mind if you want to get the most out of your design time.
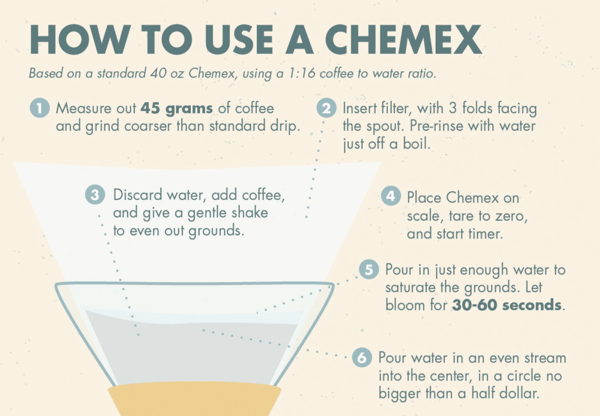
3. How to Use a Chemex
Need more caffeine to get you through the workday? This infographic teaches how to use a Chemex coffeemaker in eight, no-brainer steps. The image was crafted for a local coffee shop, and, on top of looking good, there’s even an embed link conveniently placed at the bottom of the image. That’s a clever way to encourage people to share your infographic on their websites (and to get your company more brand awareness).
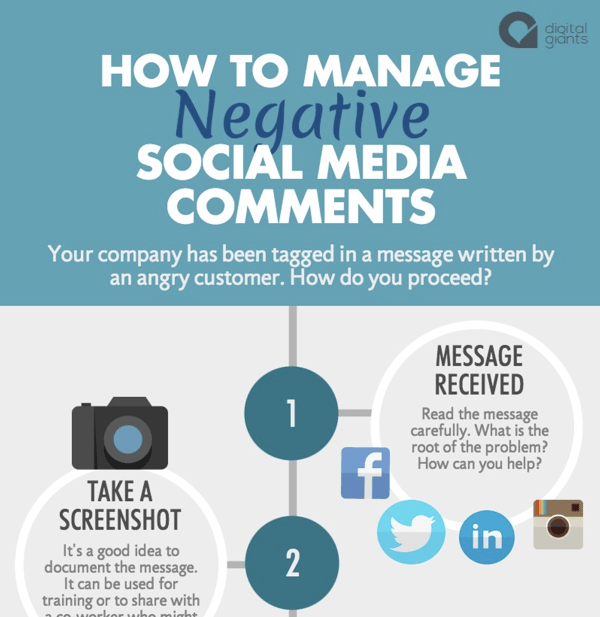
4. How to Manage Negative Social Media Comments
Yikes. You’ve recently gotten a negative comment on one of your social media accounts. Now what? Instead of getting into an ego battle on the internet for everyone to see (way not cool), take a deep breath and look at this infographic. The bubble timeline is a simple and clean way to explain a process. And by the way, the third step is the most important.
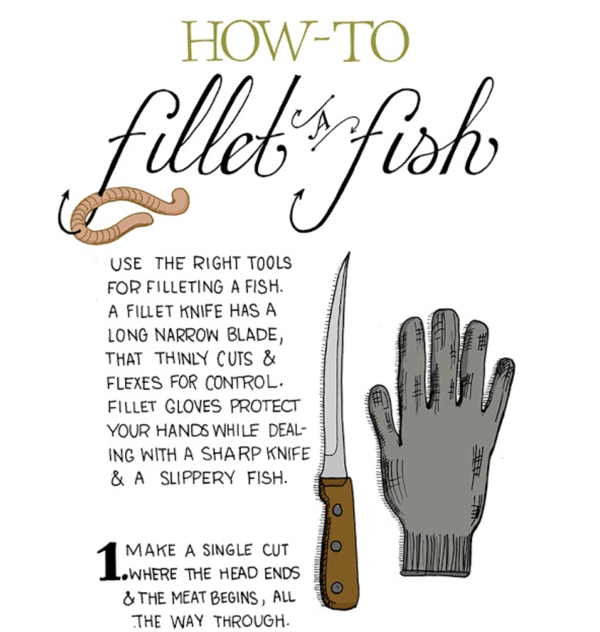
5. How to Fillet a Fish
Give a man a fish and he eats for a day. Teach a man to fish and he eats for a lifetime. But what if he doesn’t know how to fillet? This infographic is creative, good-looking with a hand-drawn design, and, most importantly, effective. It teaches us how to fillet a fish in only five steps. That is fewer steps than most infographics use, which made this design surprisingly engaging. I’m hooked.
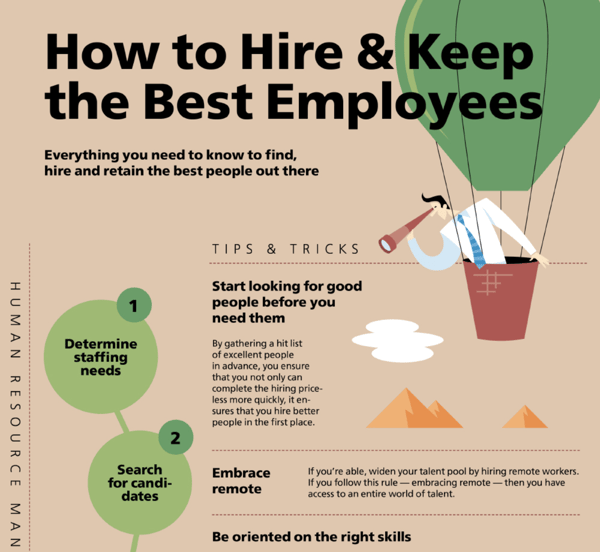
6. How to Find, Recruit, Hire, and Keep the Best Employees
Are you struggling to find (and keep) the best employees? This infographic has a fair amount of copy, but the content is valuable and worth reading—a good reminder that looks aren’t everything. On top of that, it also gives credit to the references straight on the bottom of the design, which is a best practice to keep in mind.
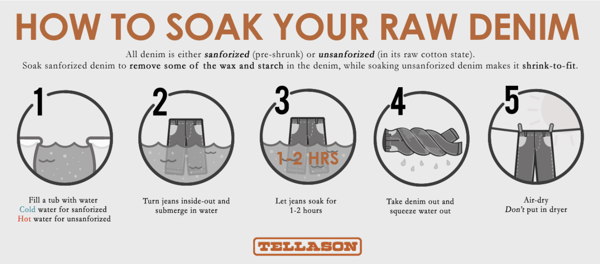
7. How to Soak Raw Denim
Nobody wants to be that guy who smells bad. Luckily, this infographic teaches you how to wash your raw denim jeans to keep you looking and smelling fresh. What’s noteworthy here is the horizontal design. Most infographics that explain a process are vertical, but the horizontal approach allows you to easily slip the image into a blog post without creating a way-too-long page.
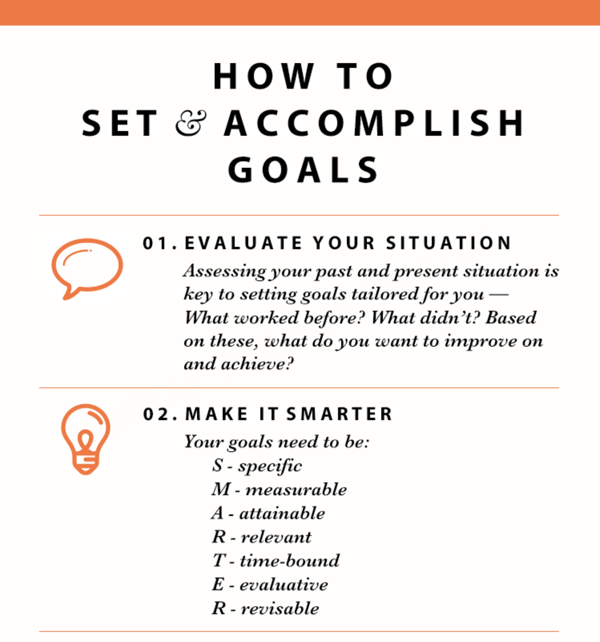
8. How to Set and Accomplish Goals
There’s an old saying that “The man who moves a mountain begins by carrying away small stones.” This infographic explains how to set and accomplish goals. It’s a pretty straightforward checklist, but do you see the sneaky lead-capture technique at the top? You can download a free PDF version of the infographic in exchange for your email address.
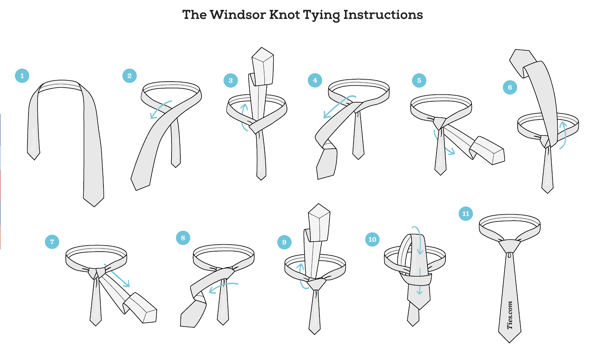
9. How to Tie a Tie
This next infographic is important for two reasons: 1) Every man needs to know how to tie a tie. 2) The infographic explains the process using zero words. Just by looking at the icons, you can learn to tie a Windsor knot and be the best-dressed dude at your next wedding. Have you considered designing an infographic like this with no copywriting?
10. How to Land Your Dream Job
If you don’t work for SmartBug, you’re probably still trying to find a way to land your dream job. This infographic from Workopolis.com teaches you the tips and tricks of how to get hired. Do you notice that almost every point it makes is backed by a statistic? Using data on an infographic always increases your trust and authority. And by the way, have you seen our Careers page? We’re hiring.

There you have it. Ten infographics that teach valuable lessons on how to explain a process. Now go out there and make some magic happen.

About the author
Benji Bateman was formerly a Marketing Consultant based out of Knoxville, TN. With three years of HubSpot experience, he’s helped 15+ clients grow their digital presence, improve their visitor-to-lead conversion rates, and drive more sales for their organizations. When he's away from his desk, he’s likely watching a Clemson football game, listening to live music, or traveling like a local. Read more articles by Benji Bateman.


