Build Success, Then Build Something New
- Blogging
- Infographics
- Conversion Optimization
- Premium Content
The result were their first annual State of Supplier Diversity reports—two surveys that examined the state of the industry from the points of view of supplier diversity professionals and diverse suppliers.
SmartBug Inbound Marketing Strategists Jessica Vionas-Singer, Kristen Patel, and Chelsea Boice worked with CVM Marketing Manager John Suarez to come up with the idea of conducting original research to examine the state of the industry from the points of view of supplier diversity professionals and diverse suppliers.
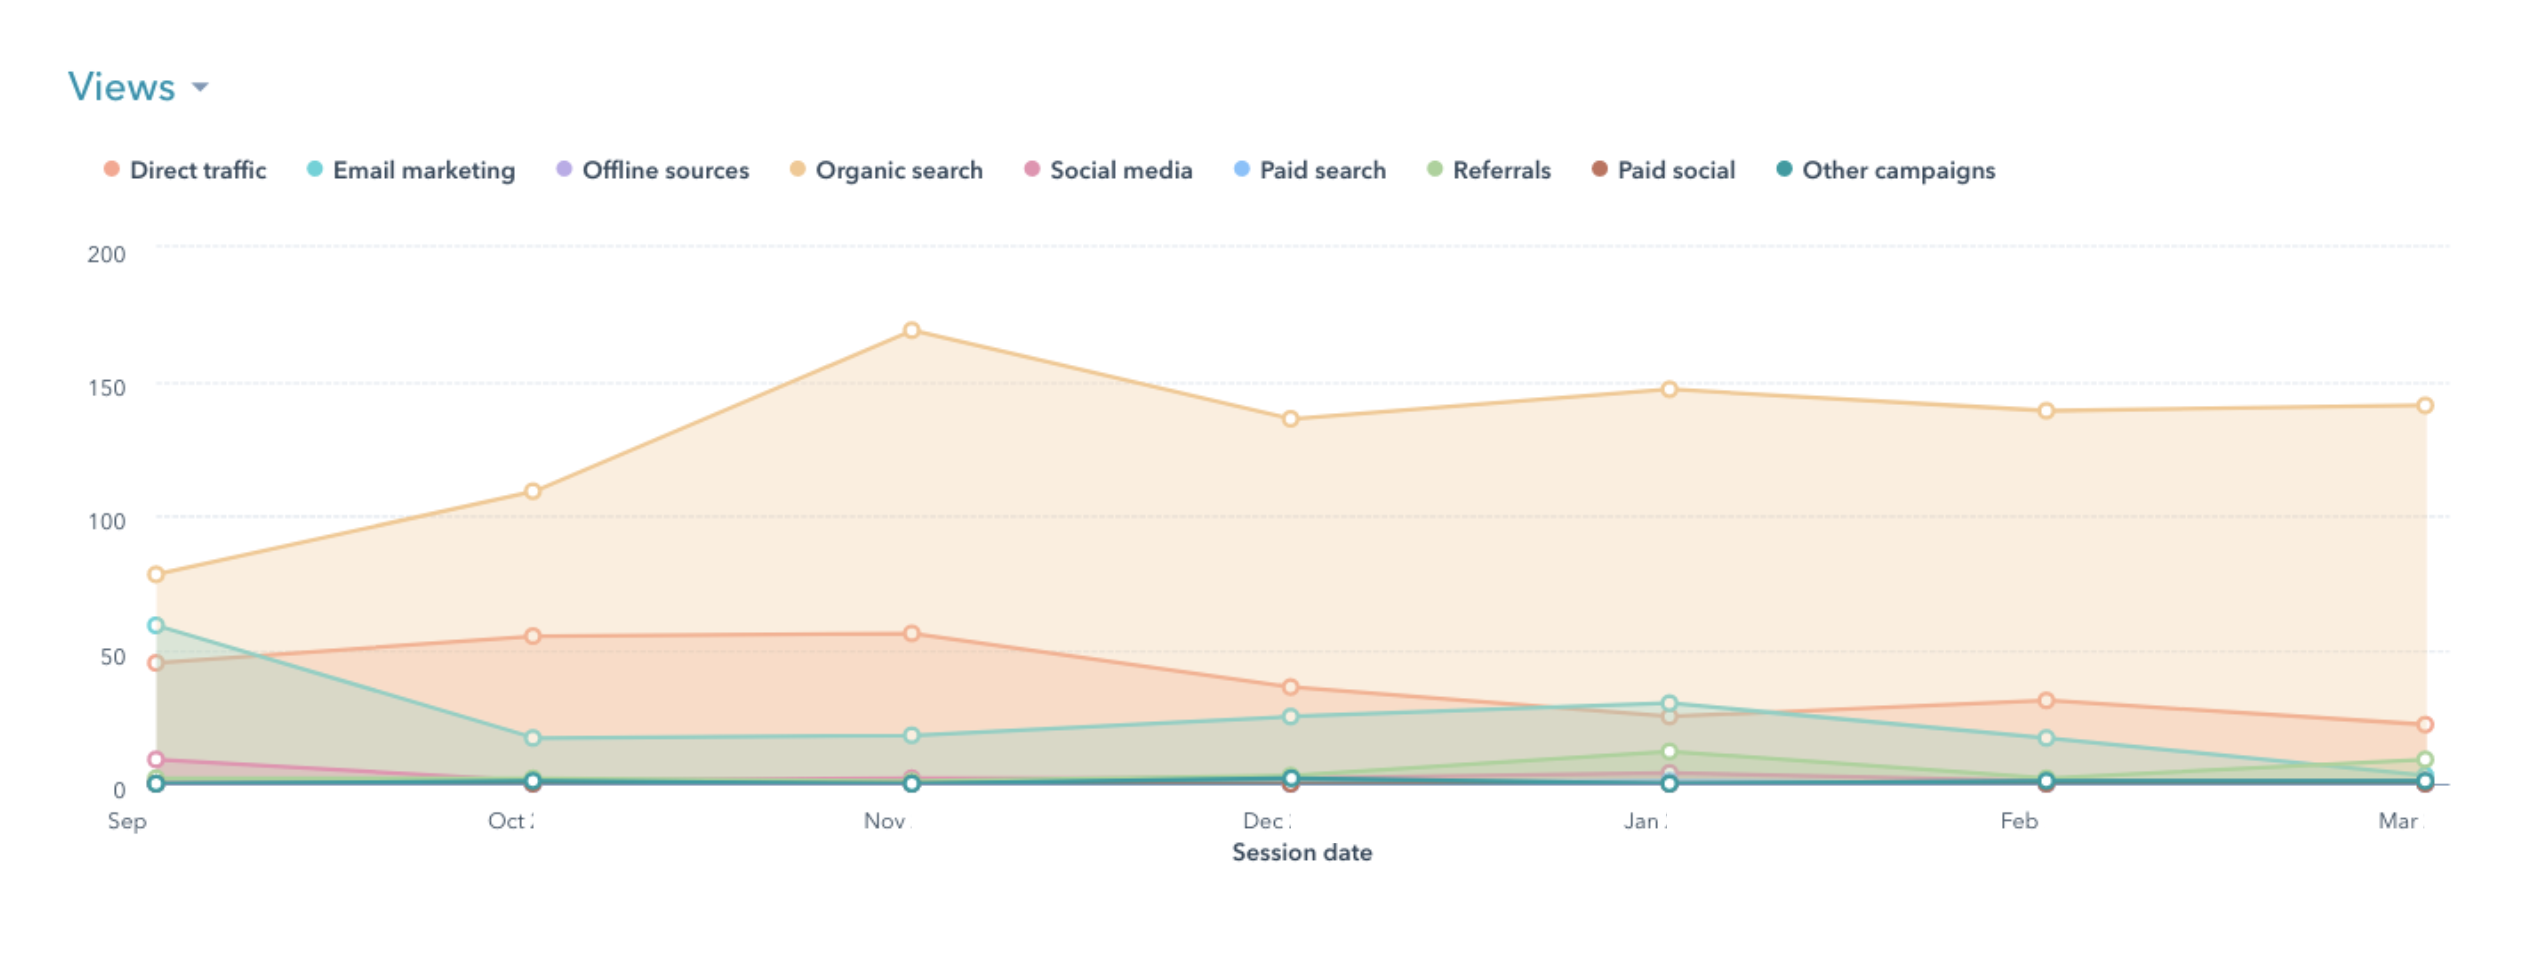
In February the surveys, promoted on the CVM website and through email marketing, were made available and drew an impressive 422 respondents. Within four months the reports had been downloaded more than 1055 times, with a submission rate of 39 percent.
The wealth of data produced was immense, as one can imagine, given 34 questions split between two surveys and more than 400 responses. The challenge would now be to take all of the data and produce something that was easily digestible and impactful. After careful analysis of the data by the strategists, SmartBug Senior Copywriter Joe Gillespie took the results and wrote two comprehensive documents: the State of Supplier Diversity reports.
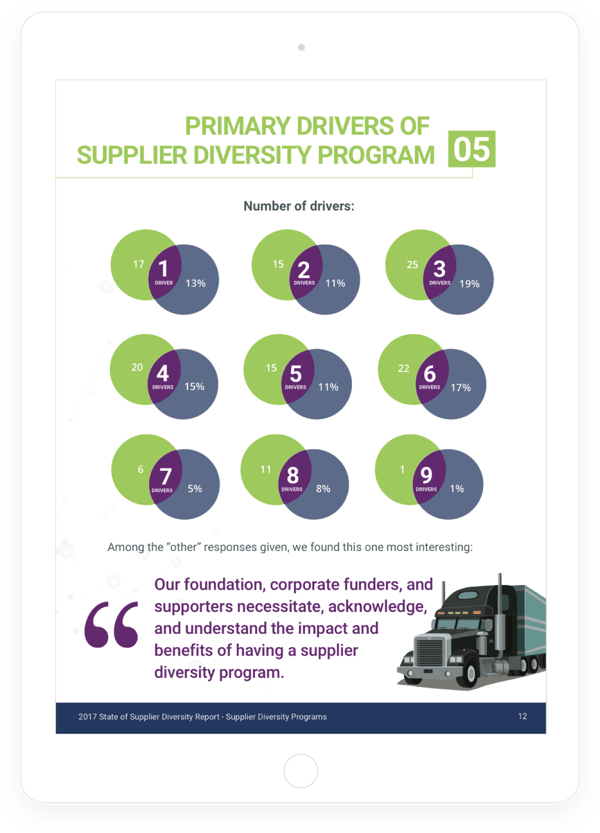
Yet those were only one piece of the puzzle, because we didn’t want the reports to be a dry data dump of black-and-white charts that would put the reader to sleep. SmartBug Designer Andy Williams was up to the challenge and started by creating a concept spread for Suarez to review. Once the direction was locked in, Williams went to work creating 49 double-page spreads of the two reports, utilizing a variety of chart types, pull-out quotes, illustrations, and highlighted statistics.
When designing these reports, it was important to follow a few key practices:
- Make the data stand out so it is clear and easy to digest
- Create a visual flow which takes the reader’s eye through the entire document
- Use large imagery to break up the data-driven content
- Showcase the data in a variety of ways to keep the document fresh to the reader
Sticking to CVM’s color palette of lime green, navy blue, cyan, and purple, the finished result was vibrant and, although packed full of data and statistics, easy to consume and process.
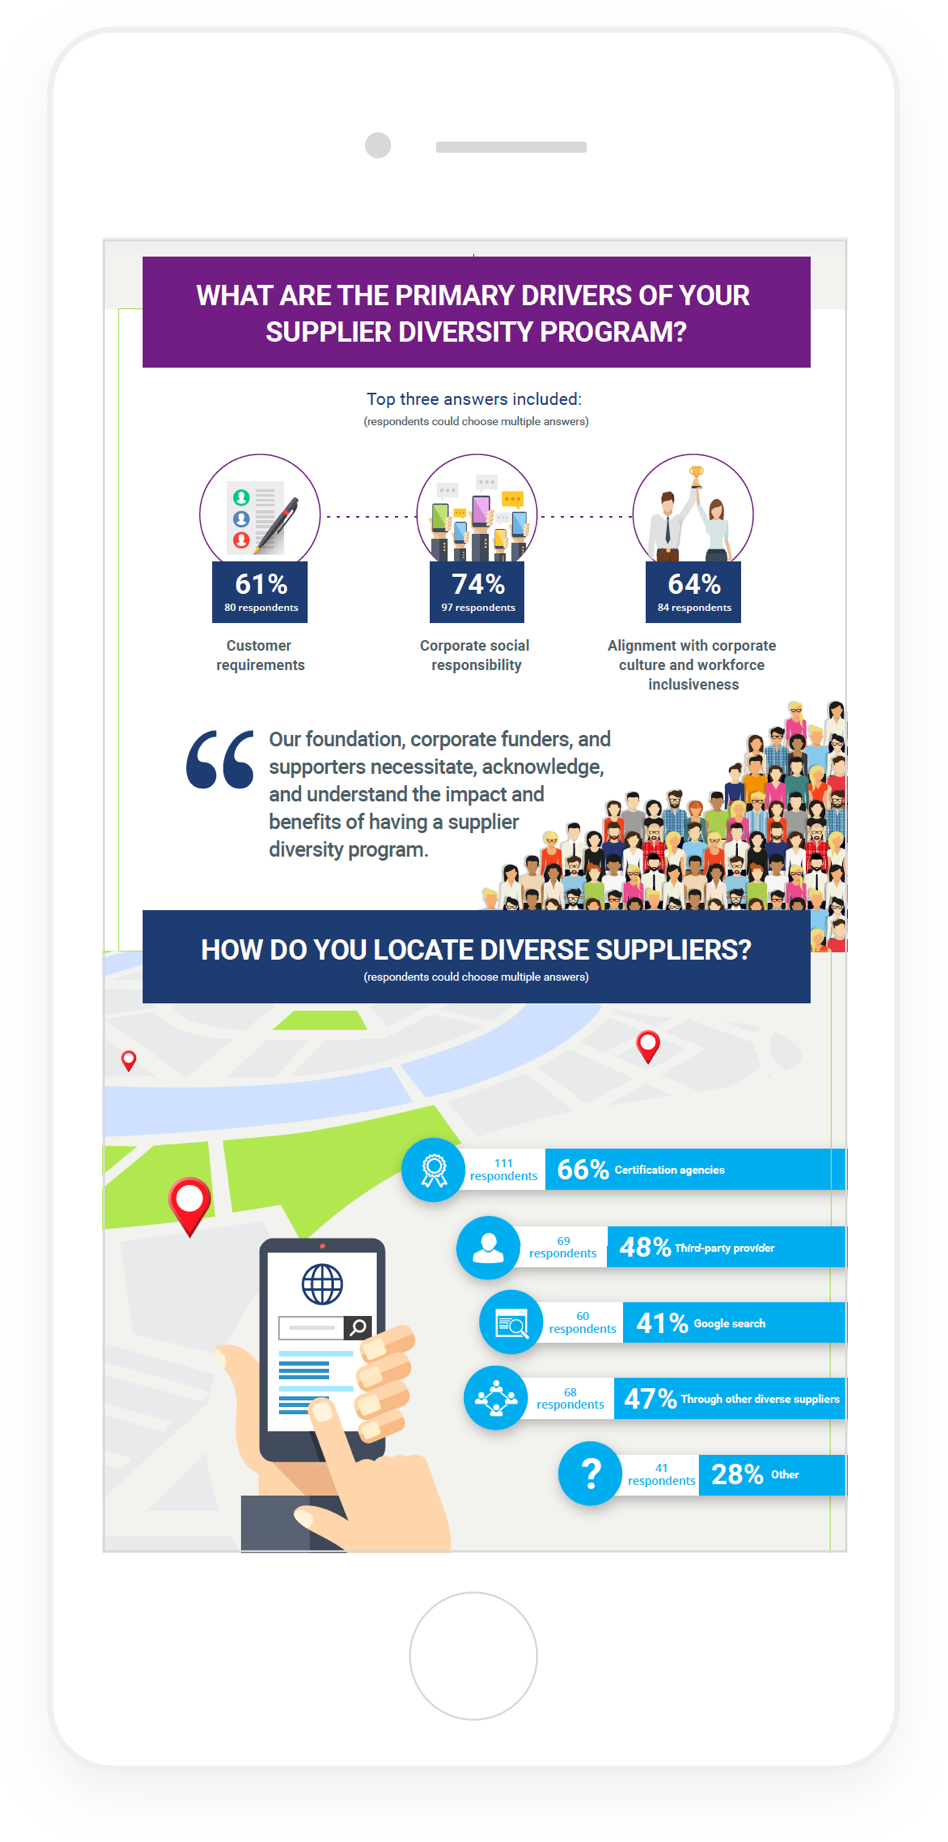
And the campaign didn’t stop there! SmartBug created two infographics that highlighted some of the key findings of each report and were published on CVM’s blog with calls to action (CTAs) to download the full reports. We also included the research in multiple blog posts, again pointing to the full reports.


